
Visually presenting data was the main focus of this week. On the supply risk matrix I redesigned a graph showing the breakdown of our risks and if the risks were unassigned or who they were assigned to within our department for support. By adding both numbers and percents to the graph I was able to quantify the data and this helped me see that percents can be ambiguous without a set amount of numbers attached to them. Redesigning this helped me see that how the data was presented mattered, and I hope to present ideas on other graphs that could be utilized to my supervisor this week. I also helped my coworker with creating graphs to show how many engineers we needed to keep up with our supply risk workload based on past data. We utilized the supply risk matrix to create this graph and compared how our workload would change month to month if we had 2 versus 5 engineers on our team. I was able to help make sure the data that was calculated was accurate and presented in a way that was easily interpretable for someone not familiar with the data. This experience helped to show me that I have the skill set needed to create graphs that extract data from other sources in order to show it visually.
I also finalized my SMART (specific, measurable, achievable, realistic, timely) goals for the internship this week. I created a powerpoint with them to visually show them and split them into 3 categories: overall internship goals, supply risk matrix goals, and my project goals. Having these goals in an easily presentable form helped to facilitate the meeting with my supervisor about them. I found that talking with my supervisor about my goals really helped me communicate to them what I wanted to get out of this internship and they were able to guide me in the direction of how I could achieve each goal and modify the goals I had set. Additionally, by talking over my goals with my supervisor he inspired another goal which I would not have thought of on my own. My goals focus on getting the most out of the internship medically, design wise, and making information accessible for non-native Spanish speakers. The medical and design aspects I knew I wanted to focus on coming into this internship, but I learned how important communicating information in another language can be and added this third aspect after a couple weeks here in my internship. I continued to see this week how visual communication is better as a communication tool across languages as well as setting goals and discussing them can lead to new directions and information!
Over the weekend we traveled to Arenal Volcano and La Fortuna. We hiked on the base of the volcano and sadly could not see much of it as it was covered by clouds, but the experience of hiking in a rainforest was incredible. We also went to the largest hot springs in the world and I loved relaxing in naturally warm water and going down water slides. It was a great trip to reset for another week of the internship.
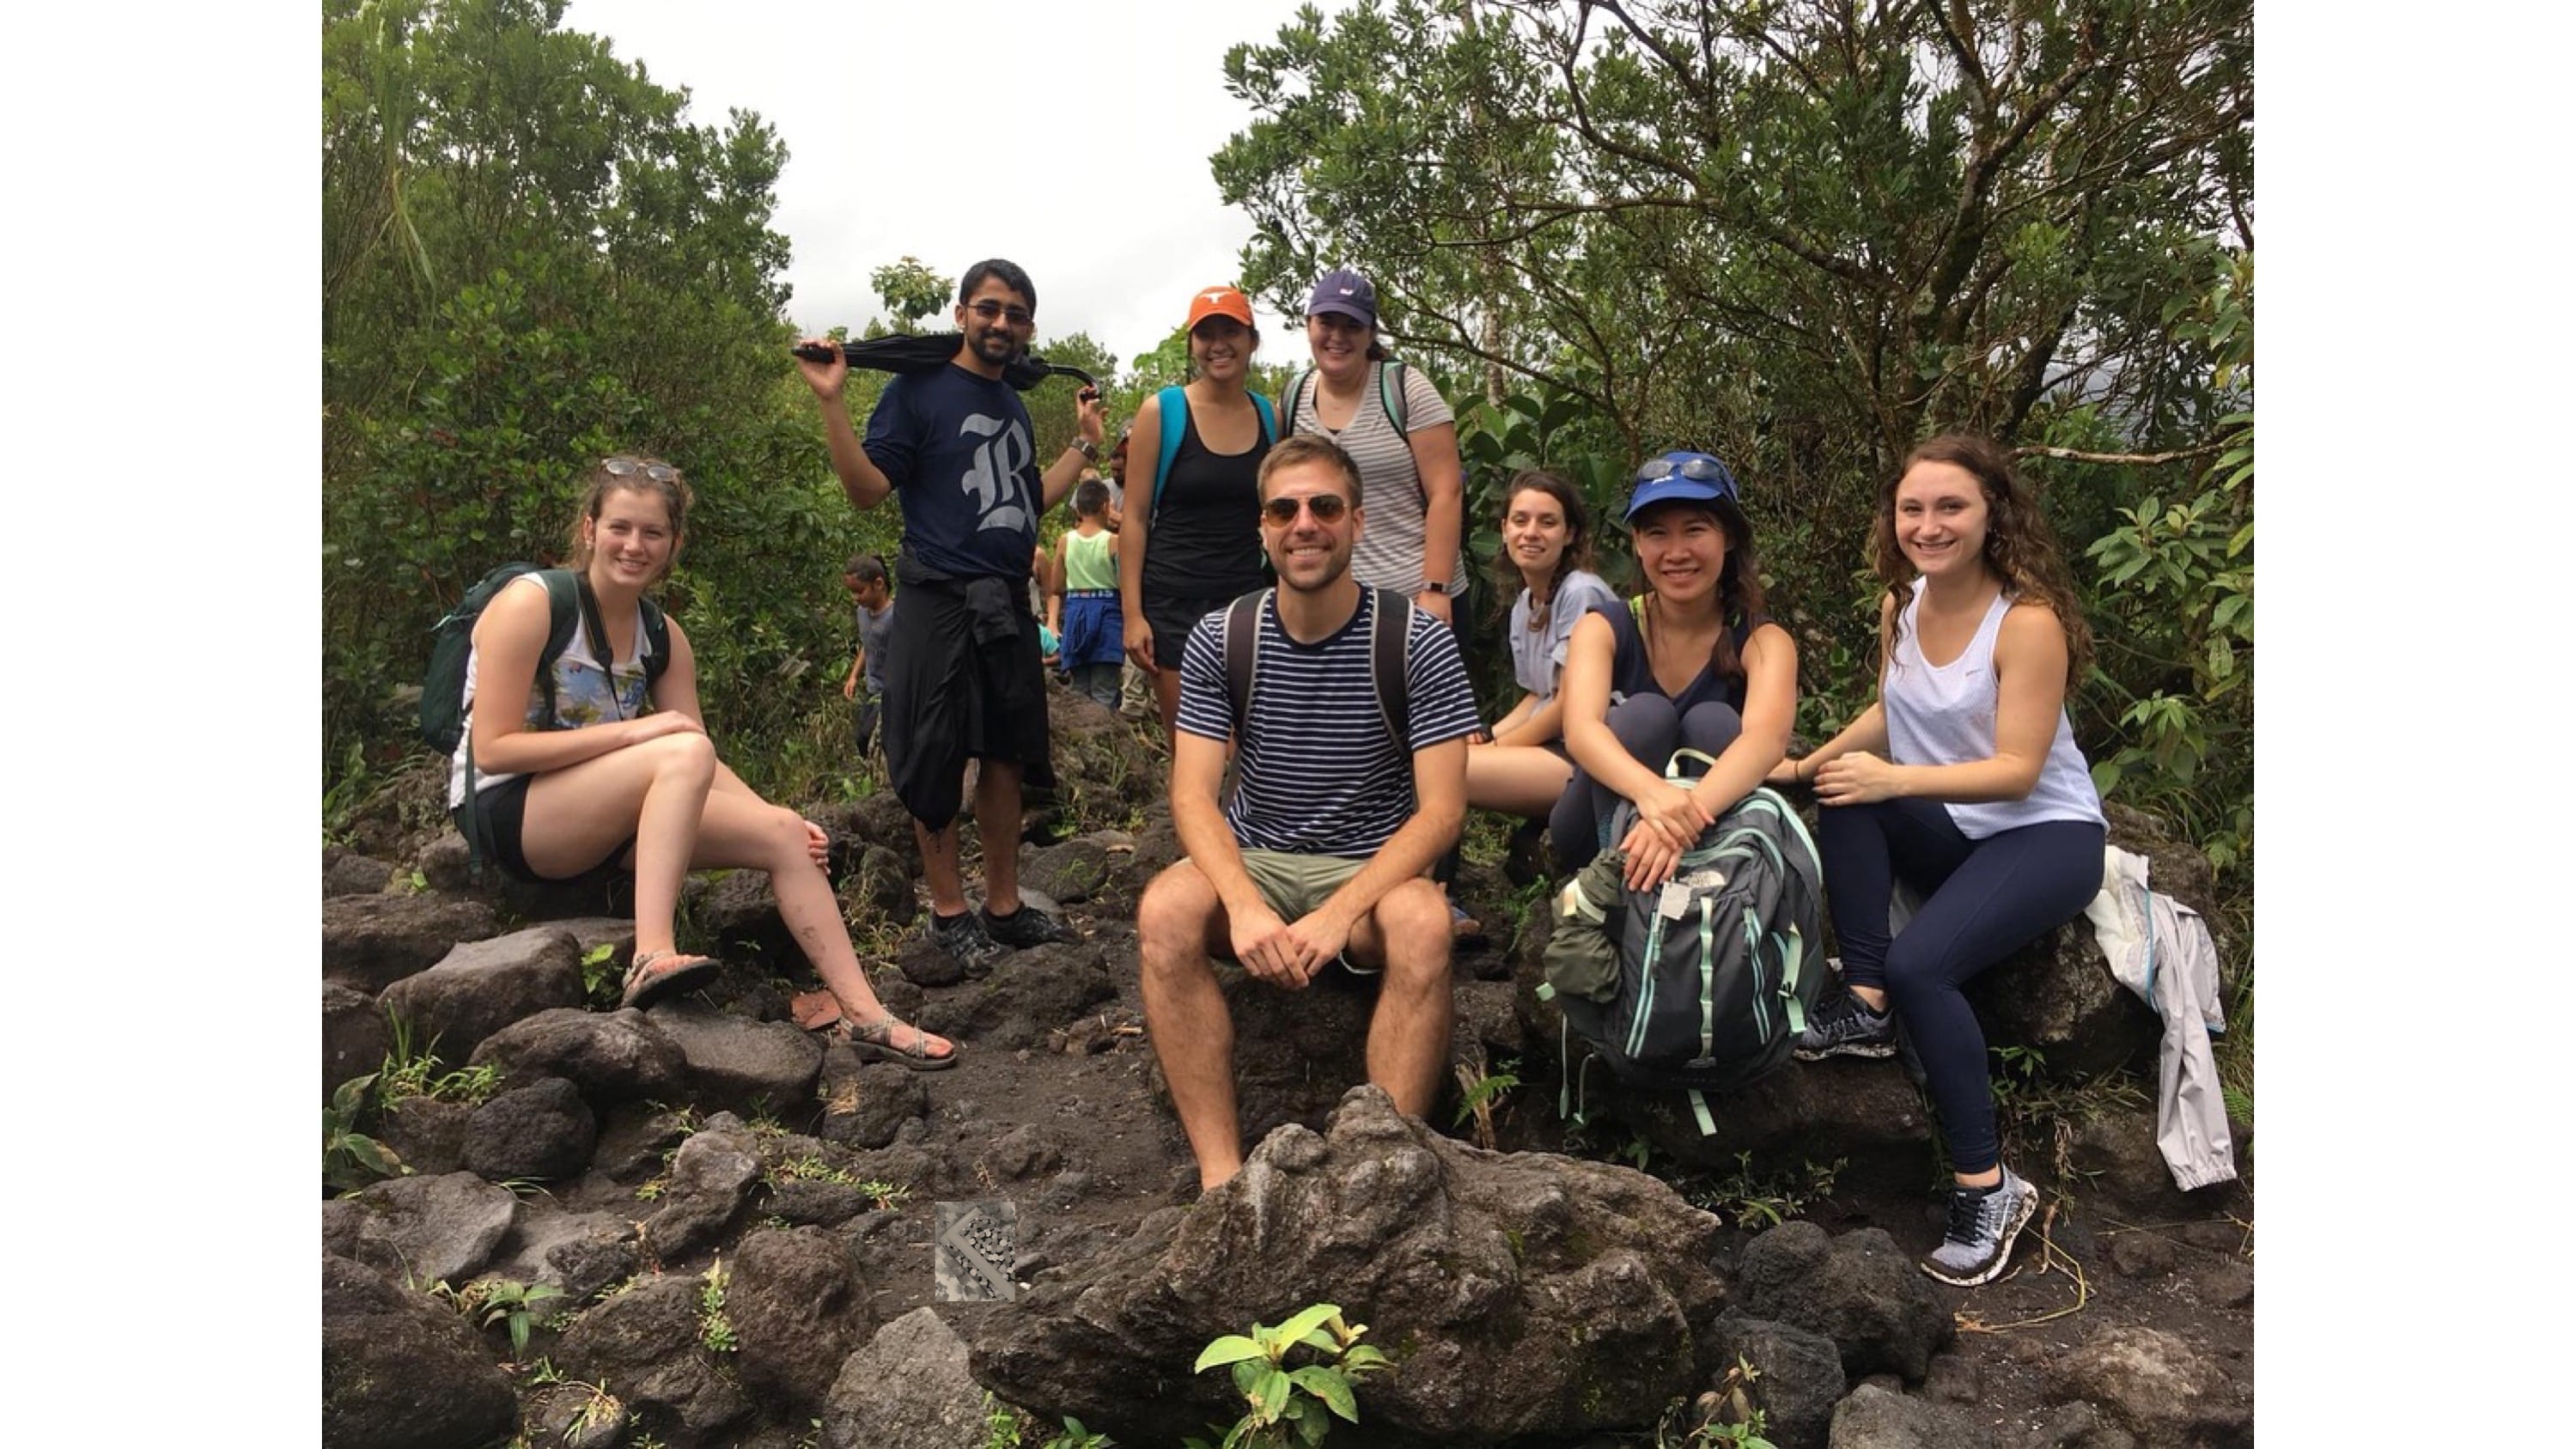
Arenal National Park Group Photo